Infographics for Web Traffic
There was a time when the DOS and UNIX operating systems ruled the world and Real ProgrammersTM referred to any graphical user interface (GUI) derisively as a "point and drool" system. Real ProgrammersTM had a certain distain for the cutesy colorful pictures inherent in such operating system. No one really uses command line interfaces today except for maybe travel agents. The pretty picture has won out and continues to win out in all facets.
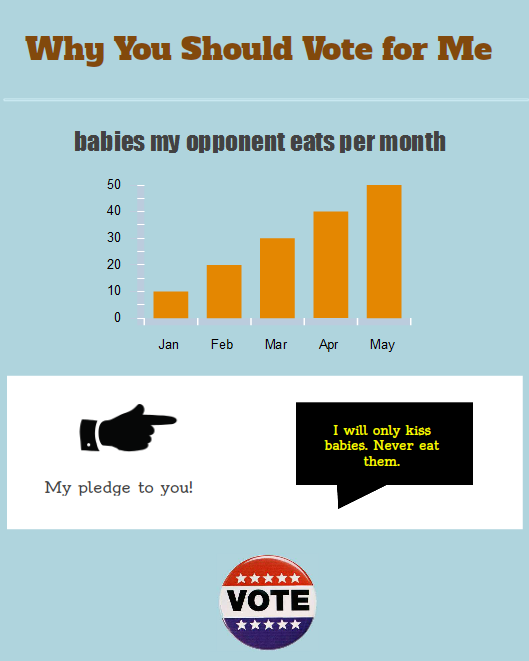
The most powerful trend these days in communicating information is the "infographic". As the name implies, it's communicating information using images. Anyone who has ever witnessed a political race knows how powerful a pie chart or bar chart can be ("Number babies my opponent eats per month"). Good infographics take it to the next level, presenting complex information in ways that are easy to digest and scales/relationships can be quickly grasped.
When creating an infographic, especially when presenting statistics visually, one should be ethical. There's a great book called How To Lie with Maps that dealt this subject back in the mid-1990s. A great read for a long flight.
Why?
A good Infographic can not only communicate information succinctly but it can have great viral possibilities. People like to pass on infographics. A good infographic can bring visitors to your site, people joining your Facebook page, and re-tweeting you. Humor is always a good driver of traffic. My "Which Social Networking Site is for You" infographic has been steady and regular source of re-tweets and traffic.
George Takei, better known to people as Star Trek's Sulu, has built a mini career pumping out amusing infographics, drawing millions of viewers a day to his Facebook. And as Takei demonstrates on his Facebook wall, you don't even have to be that accomplished with Photoshop and Illustrator to pull off a popular infographic.
Making
Of course, Takei is out for some quick laughs. As a company, you'll probably want to make something a little more professional. Assuming you don't have a graphic designer on staff there are web-based apps that can help you make an infographic in a snap. The best I've found is Pickto Charts. I used it to quickly dash off my "Vote for me" infographic.
When you make your infographic, don't forget to brand it. Put your company name and web site some place discreetly in the corner. If it does go viral, no one will know the source without a small bit of branding.
Distributing
A company blog is probably the best place for your infographic to reside. You can have a rich, full-sized version of the image on your blog. However, many people want to quickly pass on and share an infographic via social networks like Facebook and Twitter. When designing an infographic for social networks, remember the generally lousy image sized limitations. Facebook scales down anything above 843 x 403 (that's WxH in pixels). Twitpic, the popular photo sharing app for Twitter, scales down beyond 600 x 600. Instagram scales down past 612 x 612.
If you're going to share via Twitter or Facebook, you might want to start with one of these dimensions as your canvas and see what you can do.
Inspiration
Check out the Cool Infographics blog for some great infographics.
- Solution
- Pricing
- How Your Business Runs
- Developers
- API Documentation

©2026 BlueCamroo Inc. All righs reserved