BlueCamroo Release Notes 4.2.0
What's New in BlueCamroo?
This release completes our planned update for February 2013. In January we added a number of improvements to various areas of the program (invoicing, leads, task management). In this release, we have reworked the Dashboard feature.
The single Dashboard has been replaced by a suite of dedicated new Dashboards designed to pull together information about Leads and Sales, Projects, Invoicing and Payments, and Cases. The new Dashboard design is the first step in giving you better and more powerful new insights into your business. Future releases will add user customization and more granular control over user permissions.
Administrators will want to review the data presented on each dashboard and determine users access to the dashboards. A dashboard permission has been added to the company/group/user levels for administrator control. Right now the permission is an "all dashboards or nothing" setting. A subsequent release will give you finer control.
If you bill in multiple currencies, see the section on the new multiple currencies exchange rate fields.
Tabbed Dashboards
The old Dashboard system allowed you to mount useful graph-based reports on your dashboard. However, graphs only provide part of the information needed in terms of a "one page" overview. A lead, opportunity, sales, project, support ticketing, and invoice management system cannot adequately represent the diversity of critical data via a handful of charts on one page.
We've torn down the old dashboard and installed a new tabbed dashboard system. Each dashboard has key, critical metrics for the following areas of BlueCamroo:
- Leads
- Opportunities and Sales
- Invoices and Payments
- Projects
- Cases
At this stage, the Dashboards are not customizable. Our next evolution of the Dashboard design will be a fully customizable and configurable version that will roll out later this year.
Leads
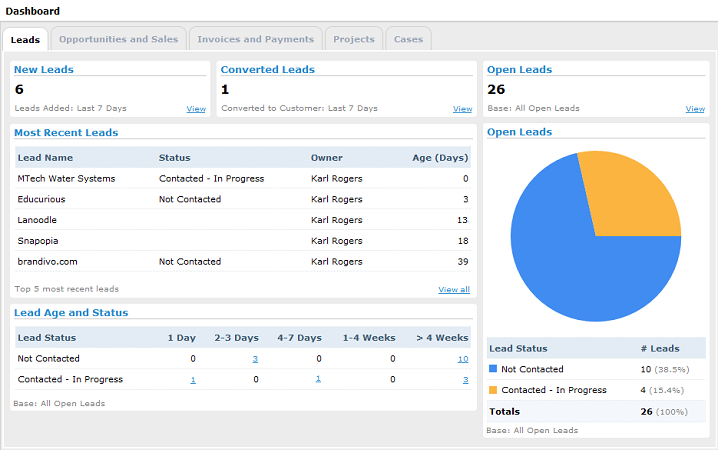
The Leads dashboard gives you a heads up on the number of new leads that have come in over the last seven days and the number that have been converted (using the Convert Lead to Customer option). The Lead Age and Status table displays leads by their initial creation date and their current lead status.
Opportunities and Sales
The Opportunities and Sales dashboard gives you an overview of opportunities in play, opportunities that have been converted to an approved project (a "sale"), and a Pipeline Valuation offering projected sales.
The key metric on this dashboard is the Pipeline Valuation table. The table displays potential sales from the start of the month to the current date. The table displays two key values. The "weighted value" and the "raw" value.
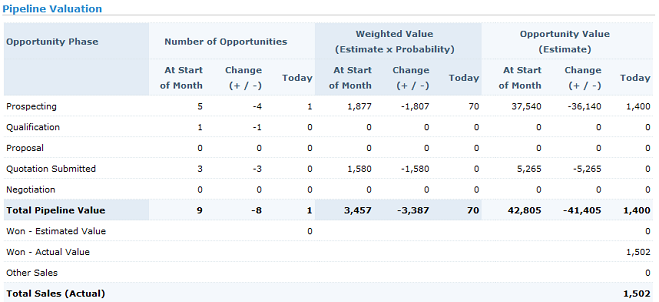
The Weighted Value is calculated by taking the total value of all opportunities in a particular stage and adjusting it based on the probability figure you've set for each Opportunity Stage. For example, you have three opportunities in the Proposal stage. The three opportunities are valued at $10,000 in total. The raw valuation would be $10,000. However, you've determined opportunities at the proposal stage have a 10% chance of becoming a sign contract (that is, a sale or a project). Therefore the weighted value is 10% of $10,000 or $1,000.
At the bottom of the dashboard is the Expiring Quotations table. It provides a good heads up on submitted sales quotes that have not been approved by clients and are approaching their expiration date.
Invoices and Payments
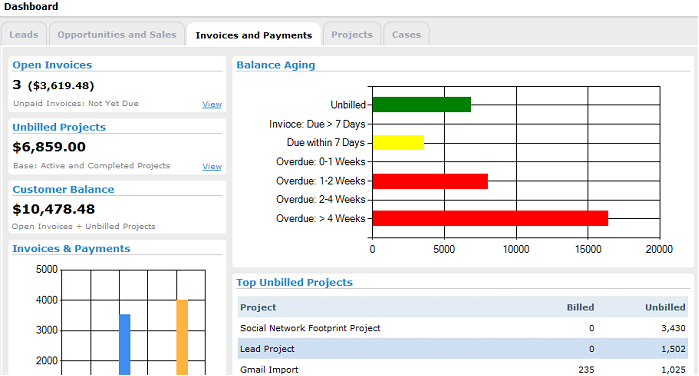
The Invoices and Payments dashboard gives you greater insight into your immediate revenue stream. What money has come in? What remains unbilled? What is owing?
The Balance Aging chart features a bar chart displaying invoice amounts. It offers a graphical representation of how much revenue remains unbilled, how much revenue is due, and how much revenue remains late and uncollected.
Projects
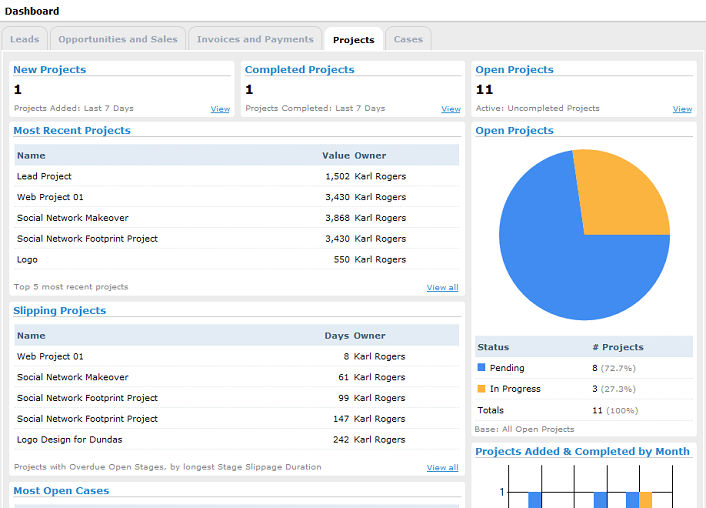
The Projects dashboard has three metrics that bear some attention.
Slipping Projects: This table will alert you to projects with at least one late stage. The project itself might not be late but it's an import heads up on which projects are not meeting their internal deadlines.
Most Open Cases: This table cross references cases associated with a project, ranking them by projects with the most open support tickets.
Unapplied Billable Time: When recording time for a project, you can flag the time logged as billable. On a project's Time Sheet (viewable via the project's Time option), you can find and apply this time via the Billing tab. It is, however, easy to miss or forget to apply this time. This table will alert you to any project with unapplied billable time, hence un-captured revenue.
Cases
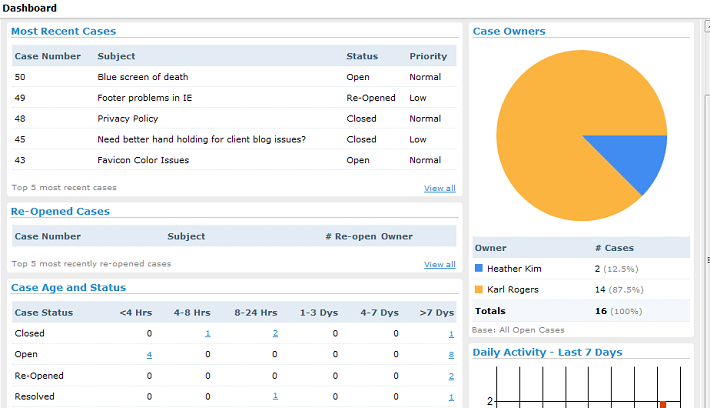
The Cases dashboard gives you an at-a-glance overview of your support ticketing workflow for the past 7 days. How many new cases have come in? How many have been closed? How many cases are still open and have never been closed? Some important statistics include Case Age and Status, alerting you to opened cases that remain unresolved for one or more days.
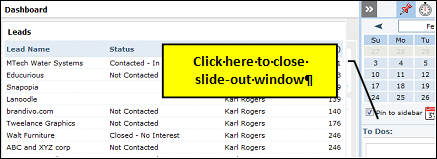
Closing those View and View All Panels
Many of the tables provide a View or View All link at the bottom right. Click this link for a pop-out list of all records. To close the window, click in the right-side information panel.
Control Access to Sensitive Information with Dashboard Permissions
Not every dashboard is appropriate for every user. We've added a dashboard permission to company/user group/user level access. Currently, administrators can set an "all or nothing" permission. In a subsequent release, we will provide a more granular permission system, allowing administrators to turn on/off access to individual dashboards.
Specifying Exchange Rates
If you're billing and quoting opportunities in different currencies, dashboards with monetary data (e.g., sales, invoices) will be converted to the default currency you've set under Setup > System Setup > Accounting > Supported Currencies. You need to set what conversion rates BlueCamroo uses for non-default currency data conversion.
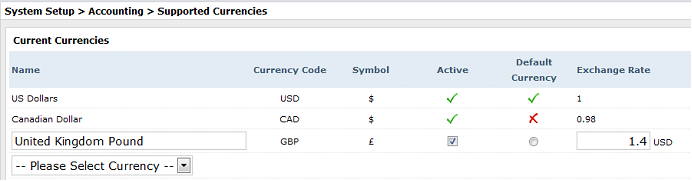
Make the rates as accurate as possible although don't sweat day-to-day differences unless one of your currencies is in serious free fall. This conversion rate is only used for dashboard approximations and projections ("spit balling"). It won't affect your actual billing.
The Exchange Rate is relative to the default currency which is always set at 1. The additional currency exchange rate should be a decimal value of what one of the additional currency units is worth in the default currency. If you don't follow that sentence, don't feel bad. Let's say your default currency is the US dollar. You have British pounds as an additional currency. You've made a sale of 1 GBP. BlueCamroo needs to covert that to US dollars for your dashboard. 1 GBP would mean about $1.40 in your default currency. So enter 1.4 in the Exchange Rate field. In short, currencies more valuable than the default will be greater than one. Currencies less valuable will be less than one.
Excluding Closed Leads from Dashboard Reports
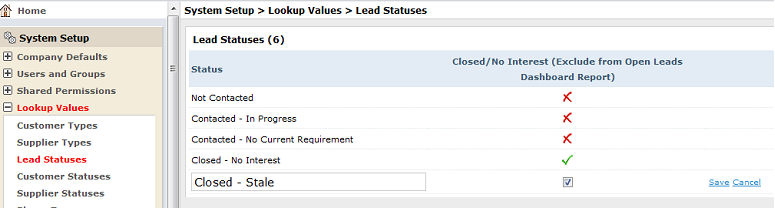
We've added functionality to the Lead Status Lookup Value (Setup > System Setup > Lookup Values > Lead Statuses) to exclude closed leads from the dashboard. You can now set whether a custom lead status represents a "closed" condition or still represents a lead open and in play.
