BlueCamroo Release Notes 5.7.0
What's New in BlueCamroo?
We've been busy adding new functionality to existing features based on your feedback. These are Quality-of-Life improvements, meant to make your workflow that much easier.
In this release, you'll find improvements to just about all areas of BlueCamroo. Nearly all of these were developed based on user feedback.
If you have any questions, ideas, or suggestions, please reach out to us at support@bluecamroo.com and we'd be glad to discuss these updates or future ones with you.
Key:

New Feature

Change to Existing Feature

Setup Instructions
Resource Management
BlueCamroo already has in-depth Time-related functionality so adding Resource Management felt like a natural fit. For Project Managers, it is very important to see, both quickly and also with great detail, their Team Members’ available Time. Also, as workflow increases, and Projects get more complex, being able to view and manage the Time of your Team Members becomes even more important.
With Resource Management in BlueCamroo, you can see what Users have been spending their Time on, as well as their availability in the future. You can see individual User’s Time usage and availability on a daily, weekly, and monthly-basis.
Such knowledge allows Managers to easily determine:
- If their Team Members are consistently being overloaded or under-utilized.
- How well a User sticks to Deadlines and Budgets.
- When and why someone had to work over Time.
- Who is available to take on new Tasks.
- See how a Task is Progressing using both planned Work Effort in hours as well as % Task completion.
- How specific User Groups are performing.
These are just a few examples of the insights Resource Management in BlueCamroo can help you gain.
BlueCamroo Users with the proper permissions are given the ability to reschedule, re-assign, and cancel Tasks directly from each individual User’s weekly Time Utilization page, and even view other User’s availability when creating new Tasks. This makes it easy for Managers to make any adjustments they need to make on the spot while cycling through their Team Members availability.
Resource Management Setup
Before getting started with Resource Management there are a few things that you will need to ensure are set up before-hand.
Permissions
What a User sees when they access on the Resource Management section of BlueCamroo is dependent on two things: their level in terms of hierarchy, and calendar sharing.
At the top-most level, Administrators will be able to access Resource Management for every User and Group in the System.
Non-admin Users will see only themselves in the User drop-down for Time Utilization, and will see all groups.
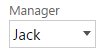
If someone has been set up as a Manager for another User (in the Personal System Settings section of System Setup), they will be able to see the Monthly Time Utilization, Monthly Task Summary, and Weekly Time Utilization for that User.
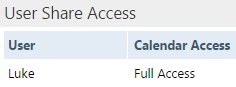
In order for a User who is not an Administrator or Manager to see the Resource Management details of another User, they will need to be granted Calendar Sharing access by the other User.
Work Hours
Managing resources (your Team Members’ Time) is dependent on their available Time, which is typically constricted to their work hours.
By default, work hours are set up as Monday to Friday, 9:00 AM to 5:00 PM. If this is not correct for your business, you will want to change it.
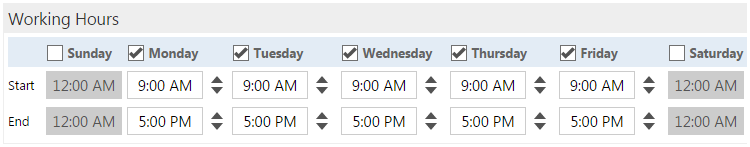
To change this, go to the Setup section of your BlueCamroo. Under System Setup, expand Company Defaults and click on Company Preferences. Scroll down to the Working Hours section, make your adjustments, and click Save.
Track Utilization
Similar to BlueCamroo’s recently released Budget Tracking feature, you will need to make sure that everyone whose details you would like to see and manage through Resource Management have their Track Utilization fields updated.
Even though you may have set work hours for your company already, each individual User may have unique circumstances which alter their work hours.
In this context, Utilization is the window of Time that the User can reliably dedicate to working on Tasks.
It is common practice for companies to give their employees some amount of ‘slack’ Time, which can be used on non Task-related work, such as work emails, calls, lunch, breaks, etc. It is necessary to adjust each individual User for this ‘slack’. Not doing so will likely result in inaccurately displaying of your employees available work Time, meaning they could be overloaded and unable to finish their required Tasks on Time.
To edit these settings, go to the Setup section for your BlueCamroo workspace, and under the System Setup, expand the Users and Groups section. Then click on Users and click on the User you need to update.
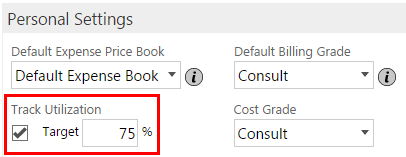
Scroll down to the Personal Settings section, and ensure that Track Utilization is checked, then, if required, add the percentage of how much of the Users work day can be dedicated to Projects and Task work, then click Save.
For example, if you use the system default work day of 8 hours, and the User has a 2 hour ‘slack’ Time for work emails, calls, lunch, etc, inputting 75% here will result in a 6-hour availability being displayed in their Resource Management section.
Note: if the Track Utilization field is left blank, it will be treated as 100% and use the full work hours as was set up under Company Preferences.
Resource Management - Monthly Time Utilization
The Resource Manager can be accessed by opening up the Main Navigation Panel and clicking Resource Management in the Analyze section.
Here, you can drill down to view:
- Time Utilization for Users.
- Time Utilization for Groups.
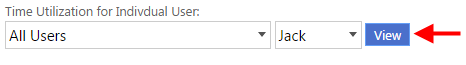
Once you have selected the User or Group you wish to view, click the appropriate ‘View’ Button.
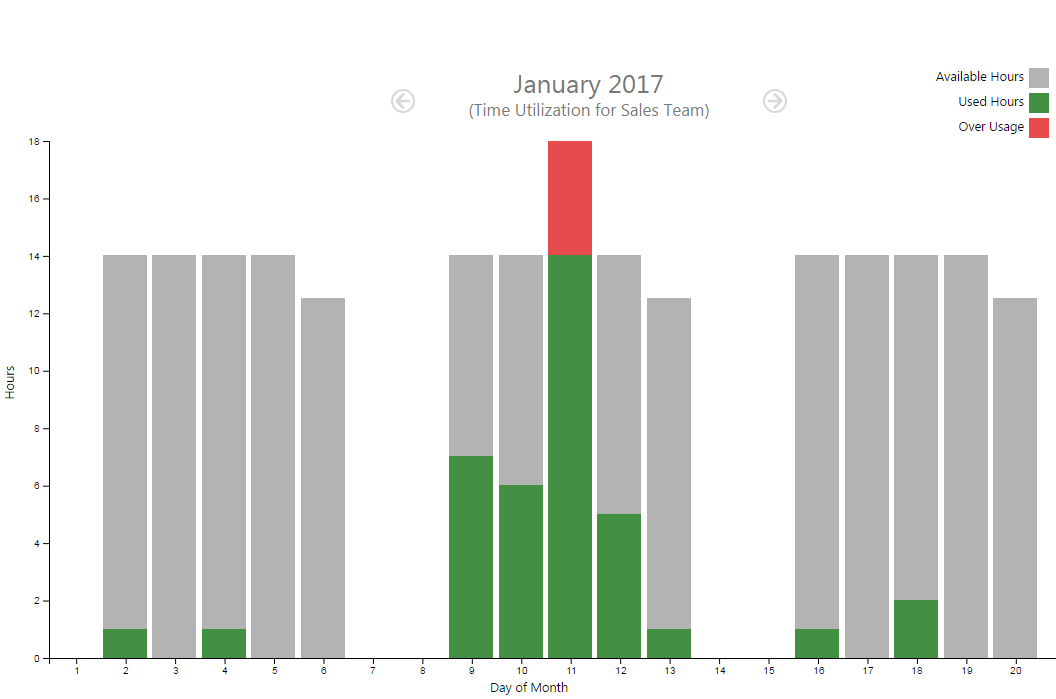
When you first enter the Resource Management section for an Individual User, you will land on the Monthly view:
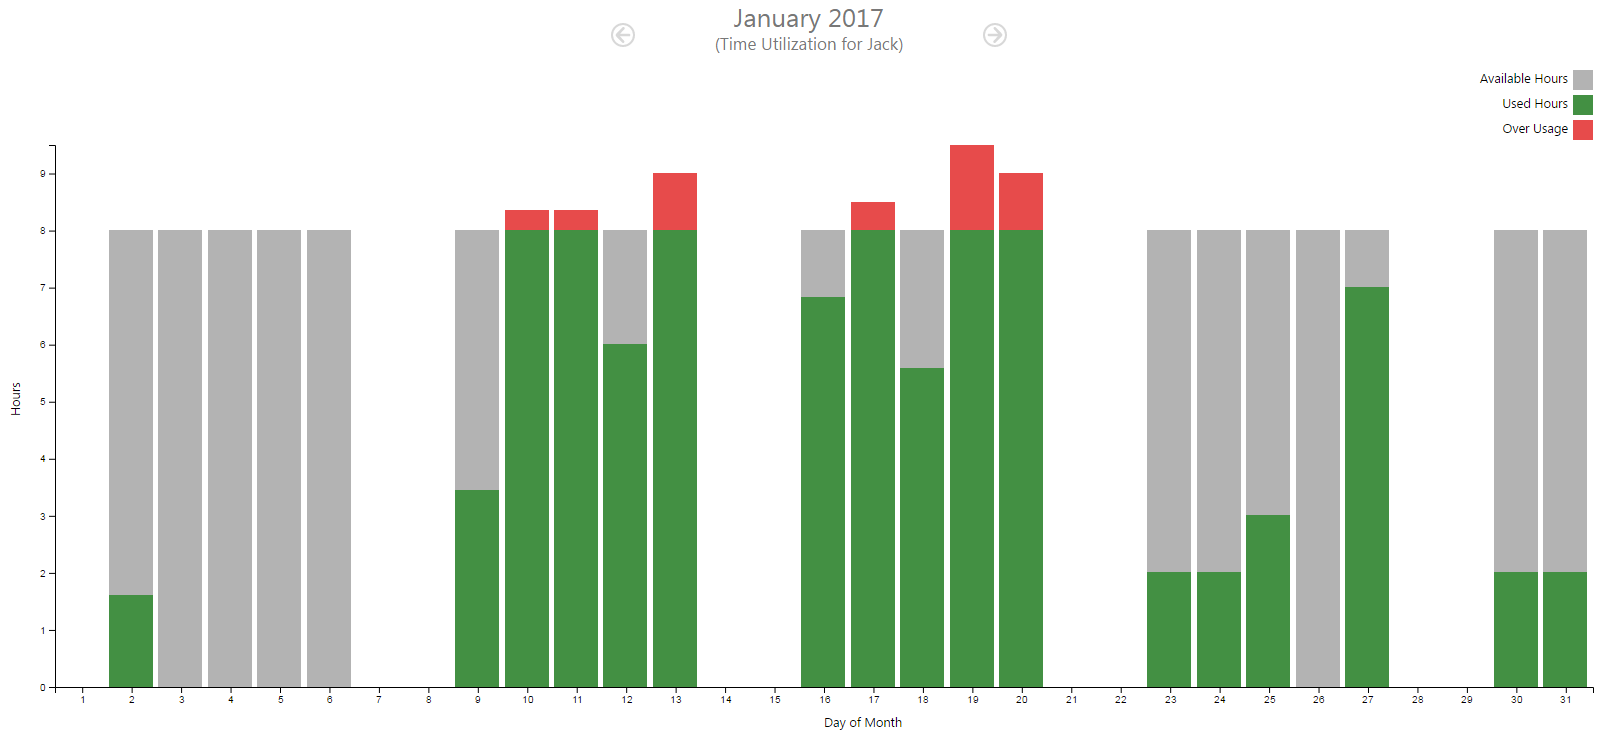
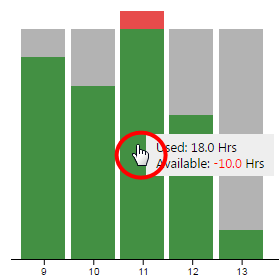
This view will display the Users monthly Time Utilization in a bar graph. The vertical-axis represents hours, and the horizontal-axis represents day of the month.
Each bar represents the Users workday. Its default height is defined as their Available Hours, which is adjusted by the length of work hours set up for the Company as well as the ‘Track Utilization’ percentage (if any) set up for the User. This is represented by the color Gray.
As the User works on Tasks by logging Time, the available hours (the Gray section) will be gradually filled in by Green, representing Used Hours.
If the User logs more Time in a day than they had available, the Gray bar will be fully filled in by Green, and the additional hours logged will be represented in Red, referred to as Over Usage.
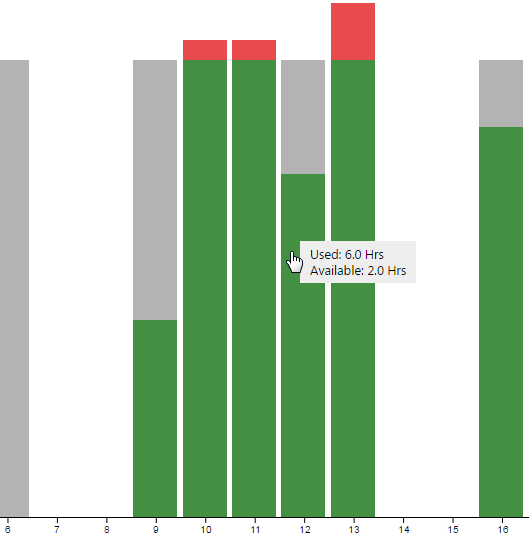
Mousing over each bar will display the Users Used and Available Hours for that day.
This monthly view will give you an overview of how well utilized the User is. This can help you gain insights on how to better manage that User. For example, if the User is consistently turning in Tasks late, but you see on their Monthly Time Utilization chart that they are also consistently going over their daily Available Hours, the User is likely over worked and some of their Tasks should likely be rescheduled or re-assigned.
On the Actions Bar, you will see a button for ‘Monthly Task Summary’ (not available for Groups). It will give you a more detailed look at the User’s Task activity for the month, more details will be provided in the following section.

If you had chosen to view Monthly Time Utilization for a Group, everything above applies except that, as mentioned, Monthly Task Summary is not available, and all of the numbers shown represent the summation of that element for all the members of the Group. This will give you a general overview of how the Group is doing for the month; whether they are over or under-utilized, and it can help you make business decisions regarding the members of the Group.
Resource Management - Monthly Task Summary for Users
The Monthly Task Summary is a report aimed at giving you an overview of the selected Users performance with Tasks for the month.
The Monthly Task Summary can be accessed by viewing the Monthly Time Utilization for an Individual User, and clicking on the Monthly Task Summary button from the Actions Bar.
On this page, you will find a Pie chart which represents the Users performance on completed Tasks for the month in relation to how well they were able to stay within budget and on Time. The Pie is divided into 4 segments, seen below.
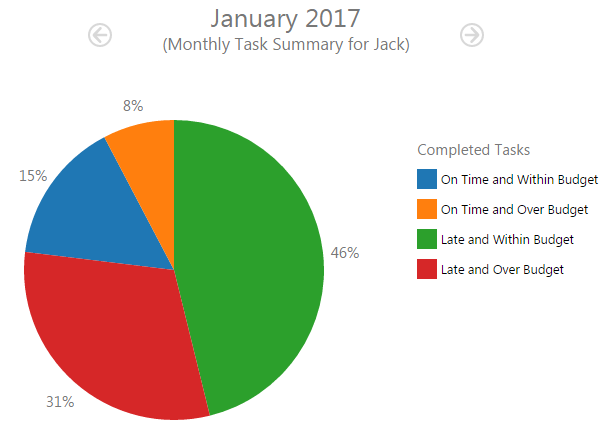
Completed Tasks that are:
- On Time and Within Budget
- On Time and Over Budget
- Late and Within Budget
- Late and Over Budget
Below the Pie chart, a table of Tasks that either has a Starting or Due Date within the given month is displayed. That will give you details about the Task Name and what it is Related To, its Start and Due Dates, Status, Completion Date (if applicable), Work Effort, and Actual Time that it took to complete the Task.
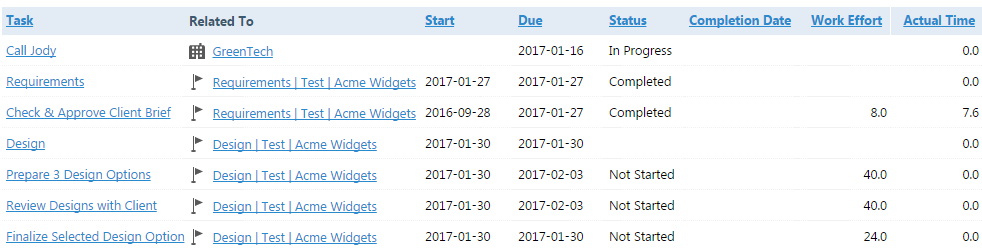
Each column is sortable and each Task details and its relations can further be explored by clicking on the Task Name or Related To links.
The Pie Chart gives you a general overview of how effective the Team Member is at delivering Tasks. If you wish to dig deeper, each segment of the Pie is clickable. This will filter the Task table below to display only Tasks that belong to that segment. This gives you the ability to narrow down on problem areas, such as Late and Over Budget Tasks, so that you can take steps to investigate what caused them, and determine whether any appropriate action is required. To return to the default table for all Tasks, click on the selected segment of the Pie Chart again.
If you want to Reschedule, Re-Assign, or Cancel the Task, select the Task from the list to activate these options, and click on the appropriate button on the Actions Bar.
Resource Management - Weekly Time Utilization view - User
As a Project Manager, the most valuable resource available to you is your Teams Time. The Weekly Time Utilization view makes it easy for you to see even more details of your teams Time Utilization, as well as give you the ability to easily Reschedule, Re-Assign, or Cancel Tasks if necessary.
To access it, open up the Resource Manager in BlueCamroo by clicking on Resource Management from the Main Navigation Panel (under the Analyze section). Once there, find and select the user you wish to manage using the drop-downs (this feature is unavailable for Groups), and click View.
Next, click on any bar in the week you would like to see, this will send you to the Weekly Time Utilization view for the User.
In this calendar-like view, you will see an in-depth representation of the Users available Time, as well as the scheduled and completed Tasks, Events, and Time that the user has logged throughout the selected week.
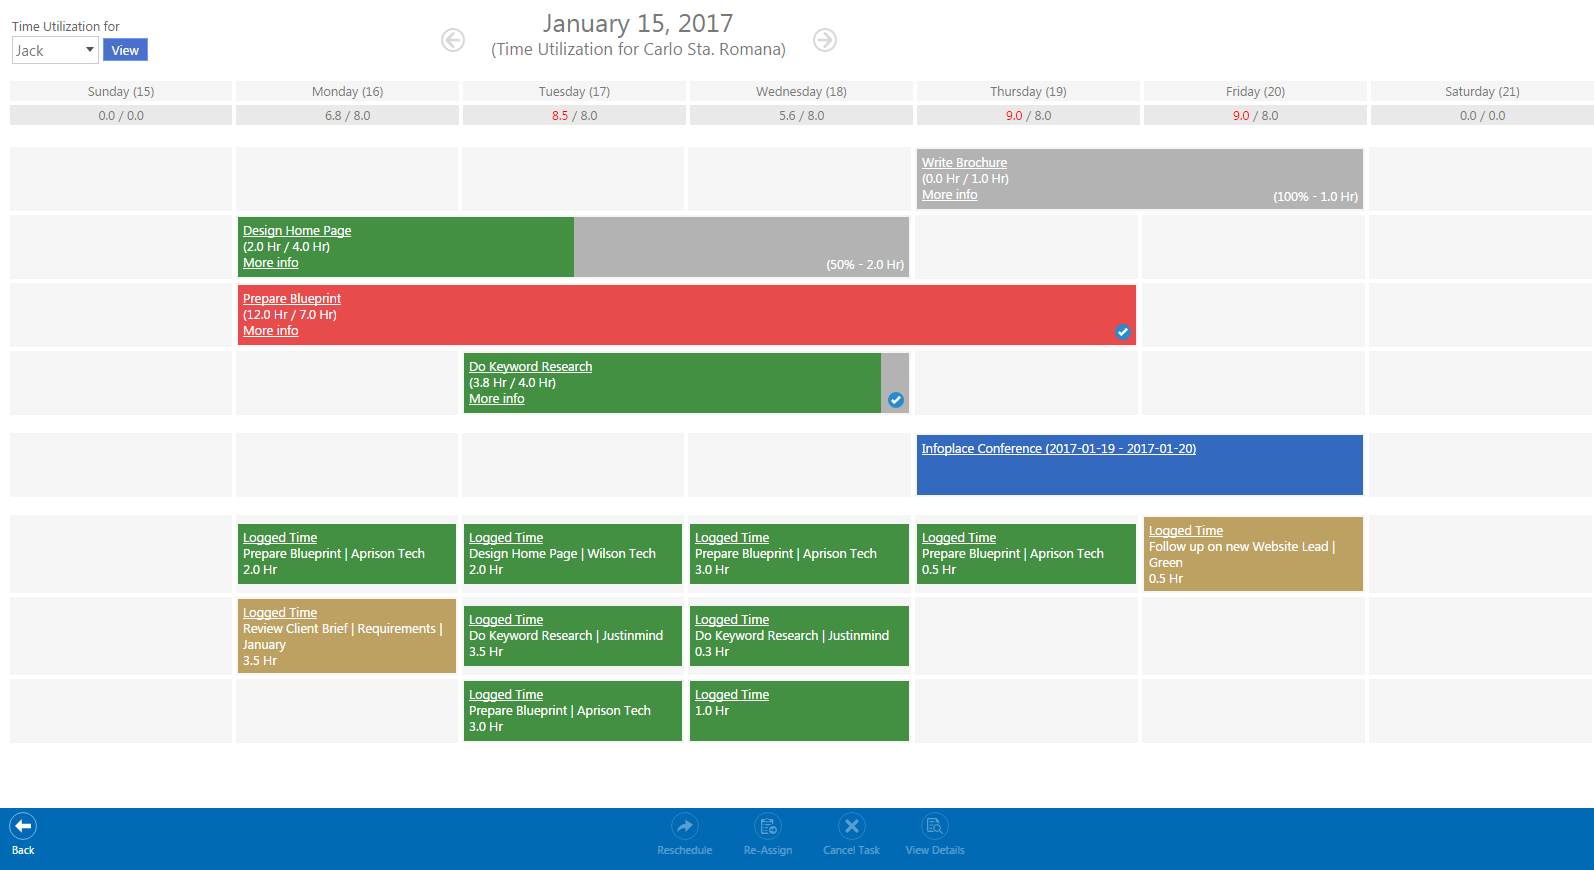
These items are represented by differently colored bars which are divided in three main sections:
- The top-most bars are Tasks,
- Followed by Events,
- and finally Logged Time.
The Bars representing these items are colored differently depending on their status or details.
Tasks
Gray represents the total Time budgeted for a scheduled Task.
As the User logs Time to the Task the grey bar will gradually fill up with Green representing how much of the Budgeted Time for the Task has been used up.

If a Task has gone over the budgeted Time, the bar will be displayed Red.
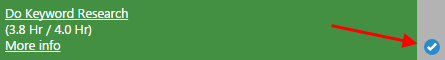
A Blue circle with a white checkmark will appear on completed Tasks.
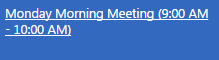
Events
Events are always displayed in Blue.
Logged Time
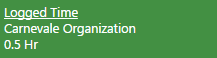
Time that has been logged within the boundaries of a Task (between Start and Due dates) is Green.
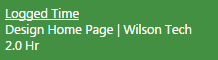
Logged Time that is not related to a Task is also Green.
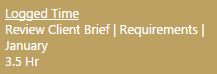
Time that has been logged that falls outside of the boundaries (Start and Due Dates) of a Task (ie. for an overdue Task) is Gold.
Interacting with Tasks in the Weekly Time Utilization View
When a Task is first created, there are 4 essential things that affect how it appears on the Weekly Time Utilization Page for a User:
- Due Date,
- Earliest Start,
- Work Effort,
- Plan Duration
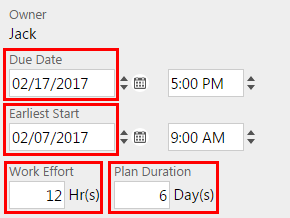
The bar for the Task will begin on its Earliest Start Date and it will end on its Due Date.
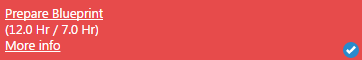
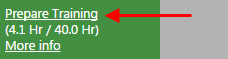
The Work Effort value is the estimated amount of work (in hours) required to complete the Task. This value is the Time budgeted for the Task. It is represented by the entire length of the bar (Gray). When the user logs Time, the bar will gradually be filled in by Green which represents how much of the budget for the Task has been used up.
Plan Duration is the number of work days that will be allotted for completing the Task.
To see more details about the Time that has been logged to the Task, click on the More Info button found on the Task bar.
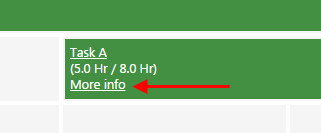
This will pop up a dialog showing basic details of the Task as well as a bar-graph indicating Logged Time for the Task.
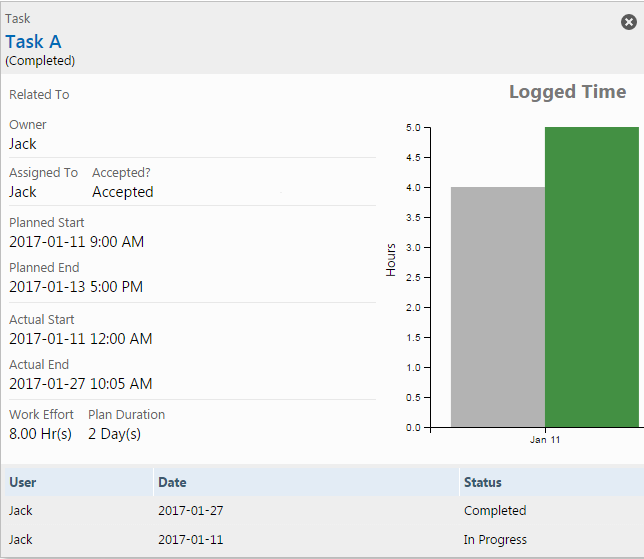
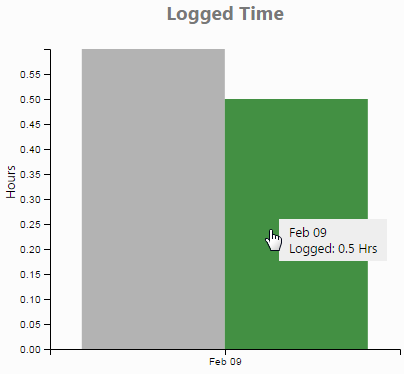
The Vertical axis represents the amount of hours that have been logged, and the Horizontal axis displays the date that the Time was logged to the Task (in chronological order). The Green bar represents the sum of Time that the User has logged for the Task on that given day, and the Gray bar represents the average daily Work Effort that is required by the User to complete the Task by its Due Date. You can mouse over these bars to see the exact values as well as the Date the Time was logged.
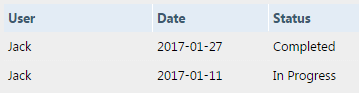
On the bottom of this overlay, we have included a list of Statuses that displays; when changes to the status of the Task were made, what they were, and by whom. In the example below, Jack first began the Task and changed the status to ‘In Progress’ on January the 11th, and Completed the Task on January 27th.
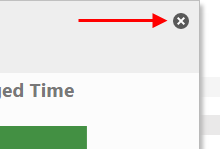
You can exit this overlay by clicking the X in the top right corner.
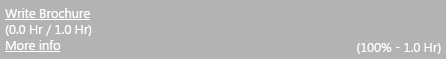
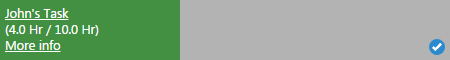
At the end of the bar for uncompleted Tasks, there are numbers representing current Task progress (in %) and how that is represented in Time left to complete.
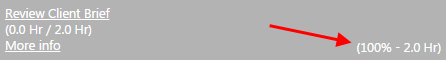
This is different than the numbers you see at the beginning of the bar representing Logged Time (in hours) vs. Work Effort required (in hours). Task completion is updated when a User updates their Task and adds progress.
Let’s go through an example to see why this is important. John has a Task that will take him an estimated 10 hours to complete over 2 days.
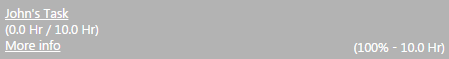
He starts working on it today and manages to do what he estimates is 80% of the work required in 3 hours, meaning he progressed on the Task much quicker than expected. He logs the 3 hours, and also adds the 80% progress to his Task.
As his manager, if you look at this Task in his Time Utilization chart, visually you’ll see a little progress, and if you look at the numbers in the beginning of the bar, you’ll only see that 3 out of 10 hours have been logged.
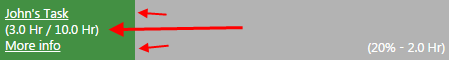
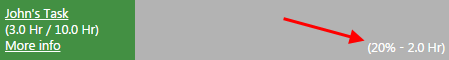
However, using the numbers at the end of the bar, you’ll see that only 20% of the work remains, and that it should require (at maximum) 2 hours. This is a closer representation of how much work is left to be done to complete the Task.
The next day, John logs the remaining 20% in 1 hour and completes the Task.
This is an example of a Task which was completed significantly below budgeted Time. If you notice this frequently with similar Tasks, you may want to adjust the budgeted Time (Work Effort) required for future Tasks like this.
Note: Some Tasks will extend beyond the week you are viewing, so you will not see this until you change over to future weeks.
Above and below the weekly Time Utilization chart, there is a tally value for the Users Time for a particular day.
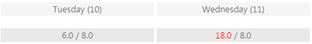
The first number is the sum of Logged Times and Scheduled Events for the day, as well as the amount of Time the User is estimated to have to work on already planned Tasks. This number is calculated by:
- Taking each Task that spans over the given day and dividing the Work Effort by the amount of days the Task spans gives a number that the User has to work . Thion the Task each day to complete the Task on Time,
- Adding the duration of any Events for the day,
- Adding the amount of Logged Time during the day.
This will give you the approximate number of hours that the User is expected to be occupied doing scheduled work throughout the day.
The second number is the total available hours the User has, adjusted by work hours and percentage of utilization that has been set up for the User.
Knowing this will give you an overview of how much Time the User has available to take on extra work, or whether you need to adjust their schedule by Rescheduling or Re-Assigning Tasks.
If you need to edit a Task for any reason, you can do that easily by clicking on the name of that Task on the Task Bar.
You can also navigate to the Tasks Details page by clicking on it (anywhere outside the text area) and clicking View Details on the Actions Bar.
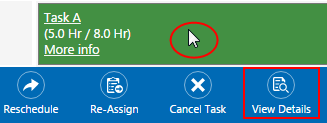
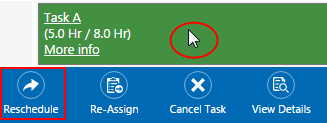
To Reschedule the Task to another Time, click on it (anywhere outside the text area) and click Reschedule on the Actions Bar.
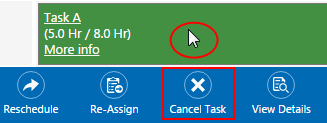
To Cancel the Task, click on it (anywhere outside the text area) and click Cancel Task on the Actions Bar.
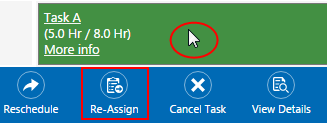
To Re-Assign the Task to another User, click on it (anywhere outside the text area) and click Re-Assign from the Actions Bar.
To return to the Monthly Time Utilization View, click the Back button on the Actions Bar.

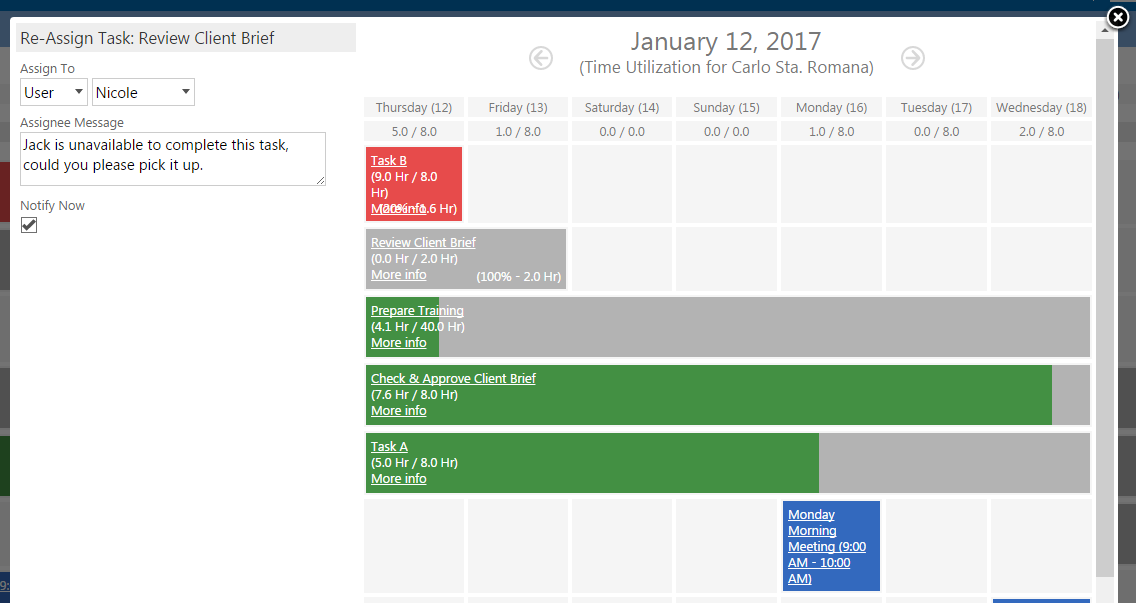
The dialog box that pops-up when you choose to Re-Assign a Task lets you choose the user you would like to Re-Assign the Task to.
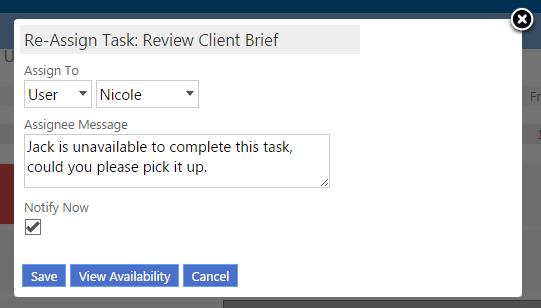
Once you have chosen a User, you can click the View Availability button to view the chosen users Weekly Time Utilization chart to determine if the User has availability to fit the Task in to their schedule.
Note: To improve usability, the new View Availability button has been added to all ‘adding’ or ‘editing’ Task overlays throughout BlueCamroo. For example. When you use the Quick Action menu to create a new Task, all you need to do is assign it to a User and add a Due Date, once you’ve done this, the View Availability button will appear, letting you see that Users Weekly Time Utilization chart.
Customer Option added to /top Section for Time Reports
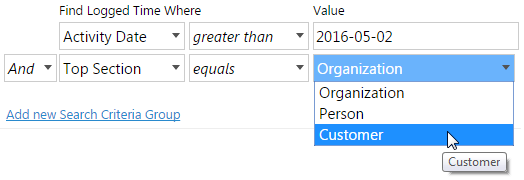
By User request, we’ve added Customer as a Top Section Option for filtering Time Reports.
Previously, the top-most sections in BlueCamroo were People and Organizations. Ultimately, every element that is related to something is related to a Person or Organization.
When you create a Time Report, you may wish to run a report that produces results that are Customers, as both People and Organizations can be Customers, Leads, Suppliers, etc. Selecting to report on Customers as a top section will give you much more specific results if you need to filter for Customers.
Email Marketing - Search can now exclude Value field
Another Customer Request, we have added the modifier ‘not contains’ for Contact Base Information Emails.
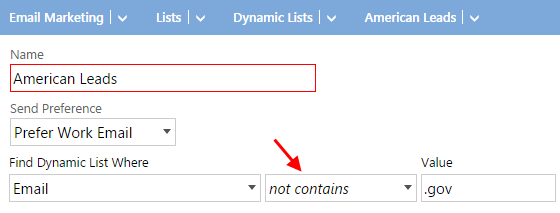
With this, you can easily exclude any part of your Contact emails’. For example: prefixes or domain names, even top level domains like .com, .edu, and .gov.
Multiple Contacts for Cases - Contact Roles
There are times where you may wish to communicate with multiple Contacts from a single Organization at once while resolving a case. Previously, you could only communicate with one Contact; the one who started the Case, or the one who was set up by the Case creator as the Primary Contact for the Case.
In this release, we’ve added a Contact Roles section to Cases, which can be found on the Summary Pane within a Case.
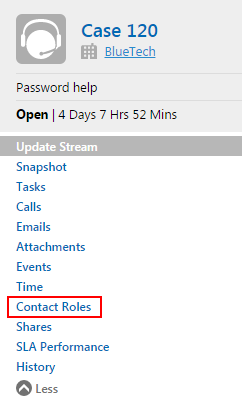
This is a simplified version of Contact Roles found within Projects and Opportunities which allows you to add additional contacts that will receive all communication shared with Customers on the Case.
Once you’ve added another Contact, any communication that is shared with Customers, replies from one of the contacts, replies from you or any other team members are shared with all of the contacts you have added in the Contact Roles section.
We hope you find these new features helpful. If you have any questions about implementing them, or if you have any suggestions or comments, please send an email to support@bluecamroo.com. We'll be glad to help!
The BlueCamroo Team
