Sales Opportunity Tracking
The Opportunities tab allows you to track sales opportunities and create a series of tasks needed to close the deal. For some, it might be a little difficult to understand why you'd use the Opportunity feature instead of just creating some tasks associated with the account. The key benefits to creating an opportunity are:
|
|
1) Organize tasks, notes, attachments, meetings, and messages under one Opportunity record. 2) Keep track of time spent on each opportunity. 3) Clearly establish team members and roles. 4) Create formal price quotes. |
If you land the contract, you can convert the opportunity to a project and all your notes, price quotes, attachments, etc. gets "rolled forward" into the project, ensuring institutional memory is preserved. Nothing worse than finding out "we promised the client what?" and having no paper trail to establish what was actually on the table.
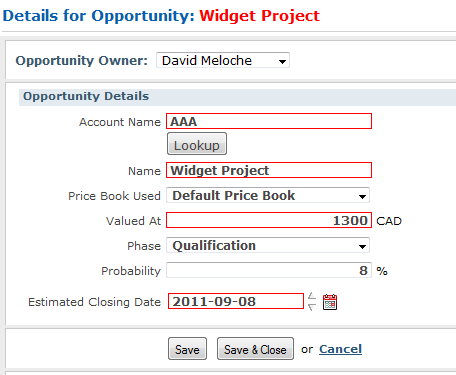
An easy to overlook feature is the Phase/Probability fields in the Opportunity Details page. As your opportunity moves through phases (prospecting, proposal, quoting, etc.) you can have the probability of landing the project automatically adjust. You might think this is just cosmetic. However, when combined with BlueCamroo's reporting system, the Phase/Probability setting can have powerful income forecasting uses.
Income Forecasting Right in BlueCamroo
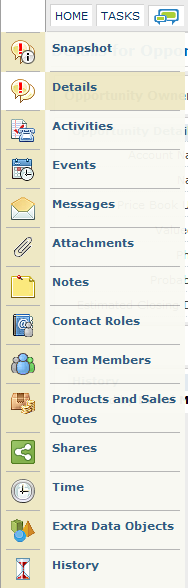
Luckily BlueCamroo provides a pre-defined Sales Opportunity Tracking report that gives you income forecasting. Just click the Home tab and then the Reports  button on the Left toolbar.
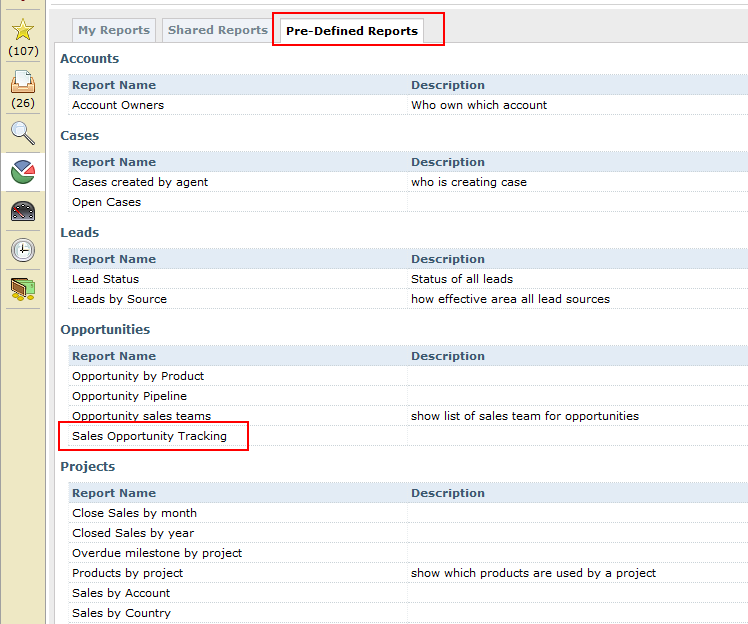
You'll see a Pre-Defined Reports tab. Click on it. Now click on the Sales Opportunity Tracking report under Opportunities.
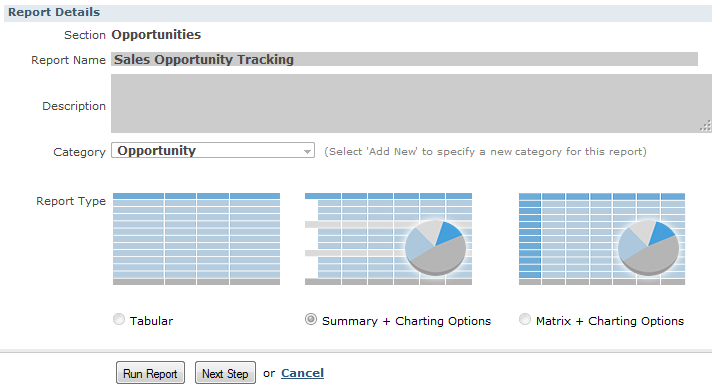
Click the Run Report button. Before you run it, enter a date range for which opportunities you wish to include in the forecast.
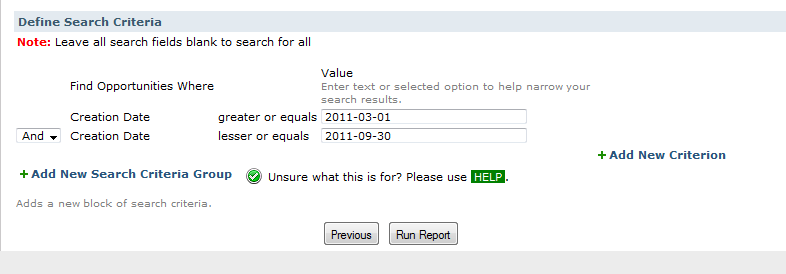
Click on the Creation Date greater or equals field to enter the start of the date range. Click on the Creation Date lesser or equals field to enter the end of the date range. Click Run Report.
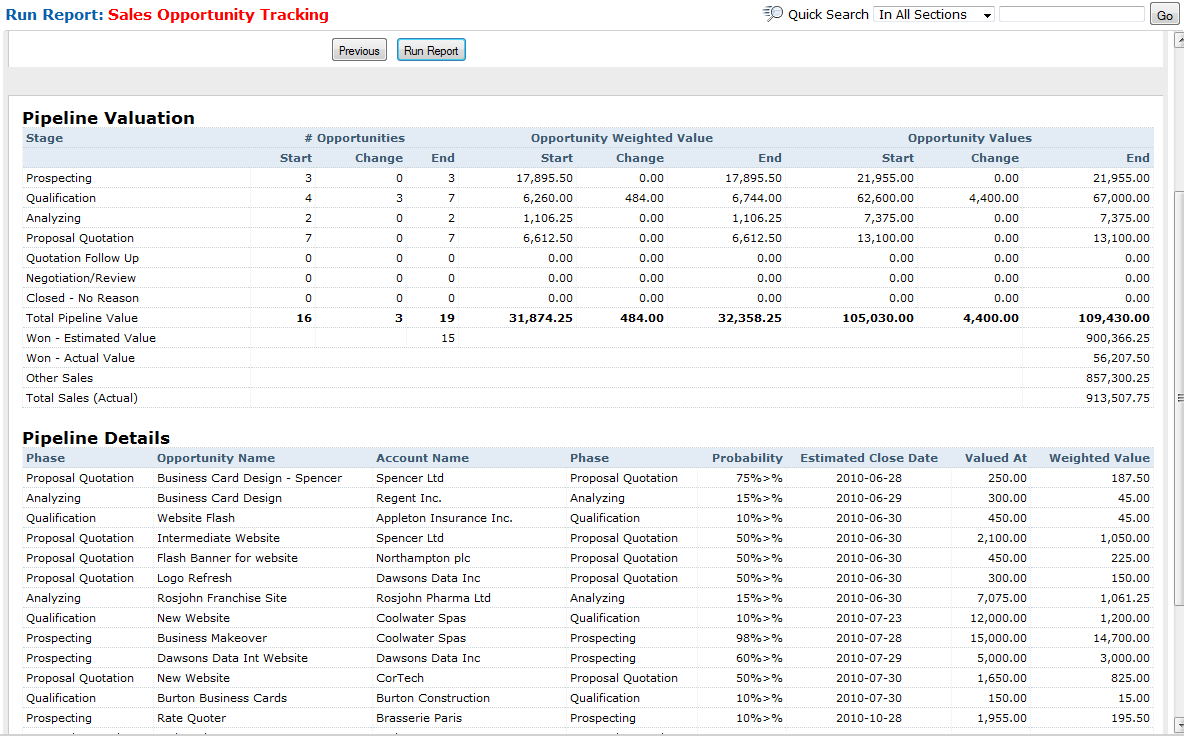
Okay, now the fun begins. If you have a lot of opportunities, you're going to get a rather intimidating table of figures. Don't panic. This blog post is going to walk you through each column and row and explain what they represent.
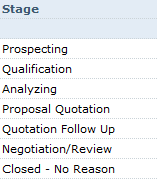
First up is the Stage column. The Stage column lists your Phases from the Opportunity details page. BlueCamroo supplies defaults, however you can adjust these under setup. A previous blog post on Opportunities details how to specify your own phases and probability figures.
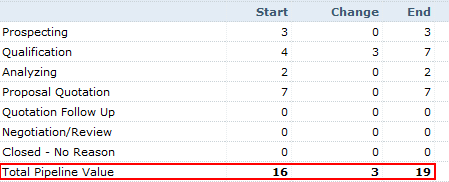
Under the familiar phases is Total Pipeline Value. This row totals up values in the other columns. Under Total Pipeline Value are Won - Estimated and Won - Actual.

Won - Estimate is the value of all the opportunities that have been converted to projects. Upon converting, whatever value is in the Valued At field on the Opportunities Details page is reflected in this table cell.
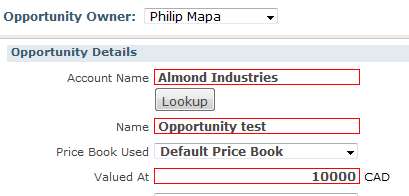
For example, let's say you have converted one opportunity and its Valued At field has $10,000. The Won - Estimate figure will show $10,000.

Won - Actual tracks the actual value of projects that started as opportunities and were converted to projects. It means to recognize, however, that the value of won opportunities can change while in the project phase. Let's say our $10,000 opportunity is converted into a project. As above, we still have Won - Estimate listing $10,000. However, as the project gets rolling, the deal changes. Products are added and the project will be billing for $15,000. The Won - Actual field will show $15,000. Over time comparing Estimate and Actual gives you a much better picture of the accuracy of your billing estimating.

Other Sales captures invoice amounts for Projects that begin life as Projects.
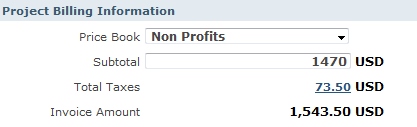
In other words, if the Project did not begin life as an Opportunity, the Other Sales cell will show a total of the Invoice Amount values of all projects in your time frame.
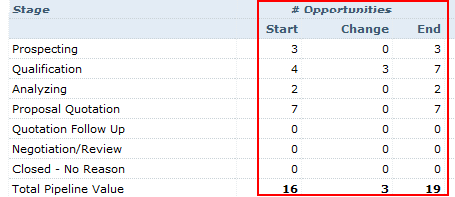
# Opportunities section gives you details of how many opportunities you have in each stage.
Start indicates how many were in that stage before the date range. For example, if your range is from September 1 to September 30 and you have three opportunities created in August but still exist as opportunities, these three opportunities will be recognized in the Start column. If an opportunity was added after September 1 but before September 30, it will appear in the Change column. The End column represents a total of Start and Change.
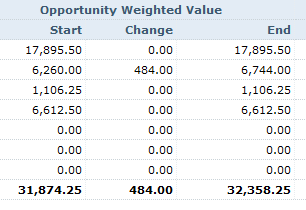
Opportunity Weighted Value is the most interesting and powerful aspect of the Sales Opportunity Tracking report. And this where using Opportunity Phase/Probability values is important. Let's say, over time, 10% of opportunities in "Qualification" phase go on to become signed deals. Those Opportunities found by your report total $100,000 in potential contracts. Your pipeline then has approximately $10,000 of future revenue. You also find 30% of Opportunities in the "Negotiation" phase become signed deals. Your report finds $20,000 worth of Opportunities in this phase. You can project, therefore, about $6,000 of future revenue.
So the Opportunity Weighted Value will show you total value of all opportunities as a percentage of their probability.
The Opportunity Values section is your unadjusted values.
To sum up, Opportunity Weighted Value shows realistic income projections. Opportunity Values shows maximum income projections if your sales staff is firing on all cylinders and lands every single opportunity.
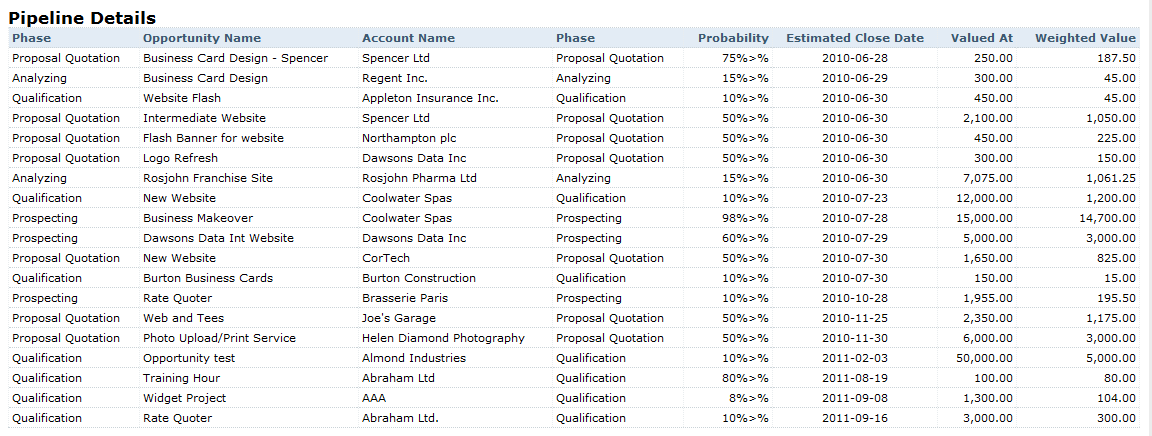
The Pipeline Details section gives a list of all opportunities in the report as well as their phase/probability and value/weighted value.
- Solution
- Pricing
- How Your Business Runs
- Developers
- API Documentation

©2026 BlueCamroo Inc. All righs reserved